Turn raw transaction tables into typologies and patterns.
Cali Pivot is the pattern-analysis surface of the Cali Technologies investigation platform. It lets teams slice transactions by chain, asset, entity, risk band, typology, and time to see how behavior clusters—and to produce narrative drafts and findings summaries for the patterns that matter.
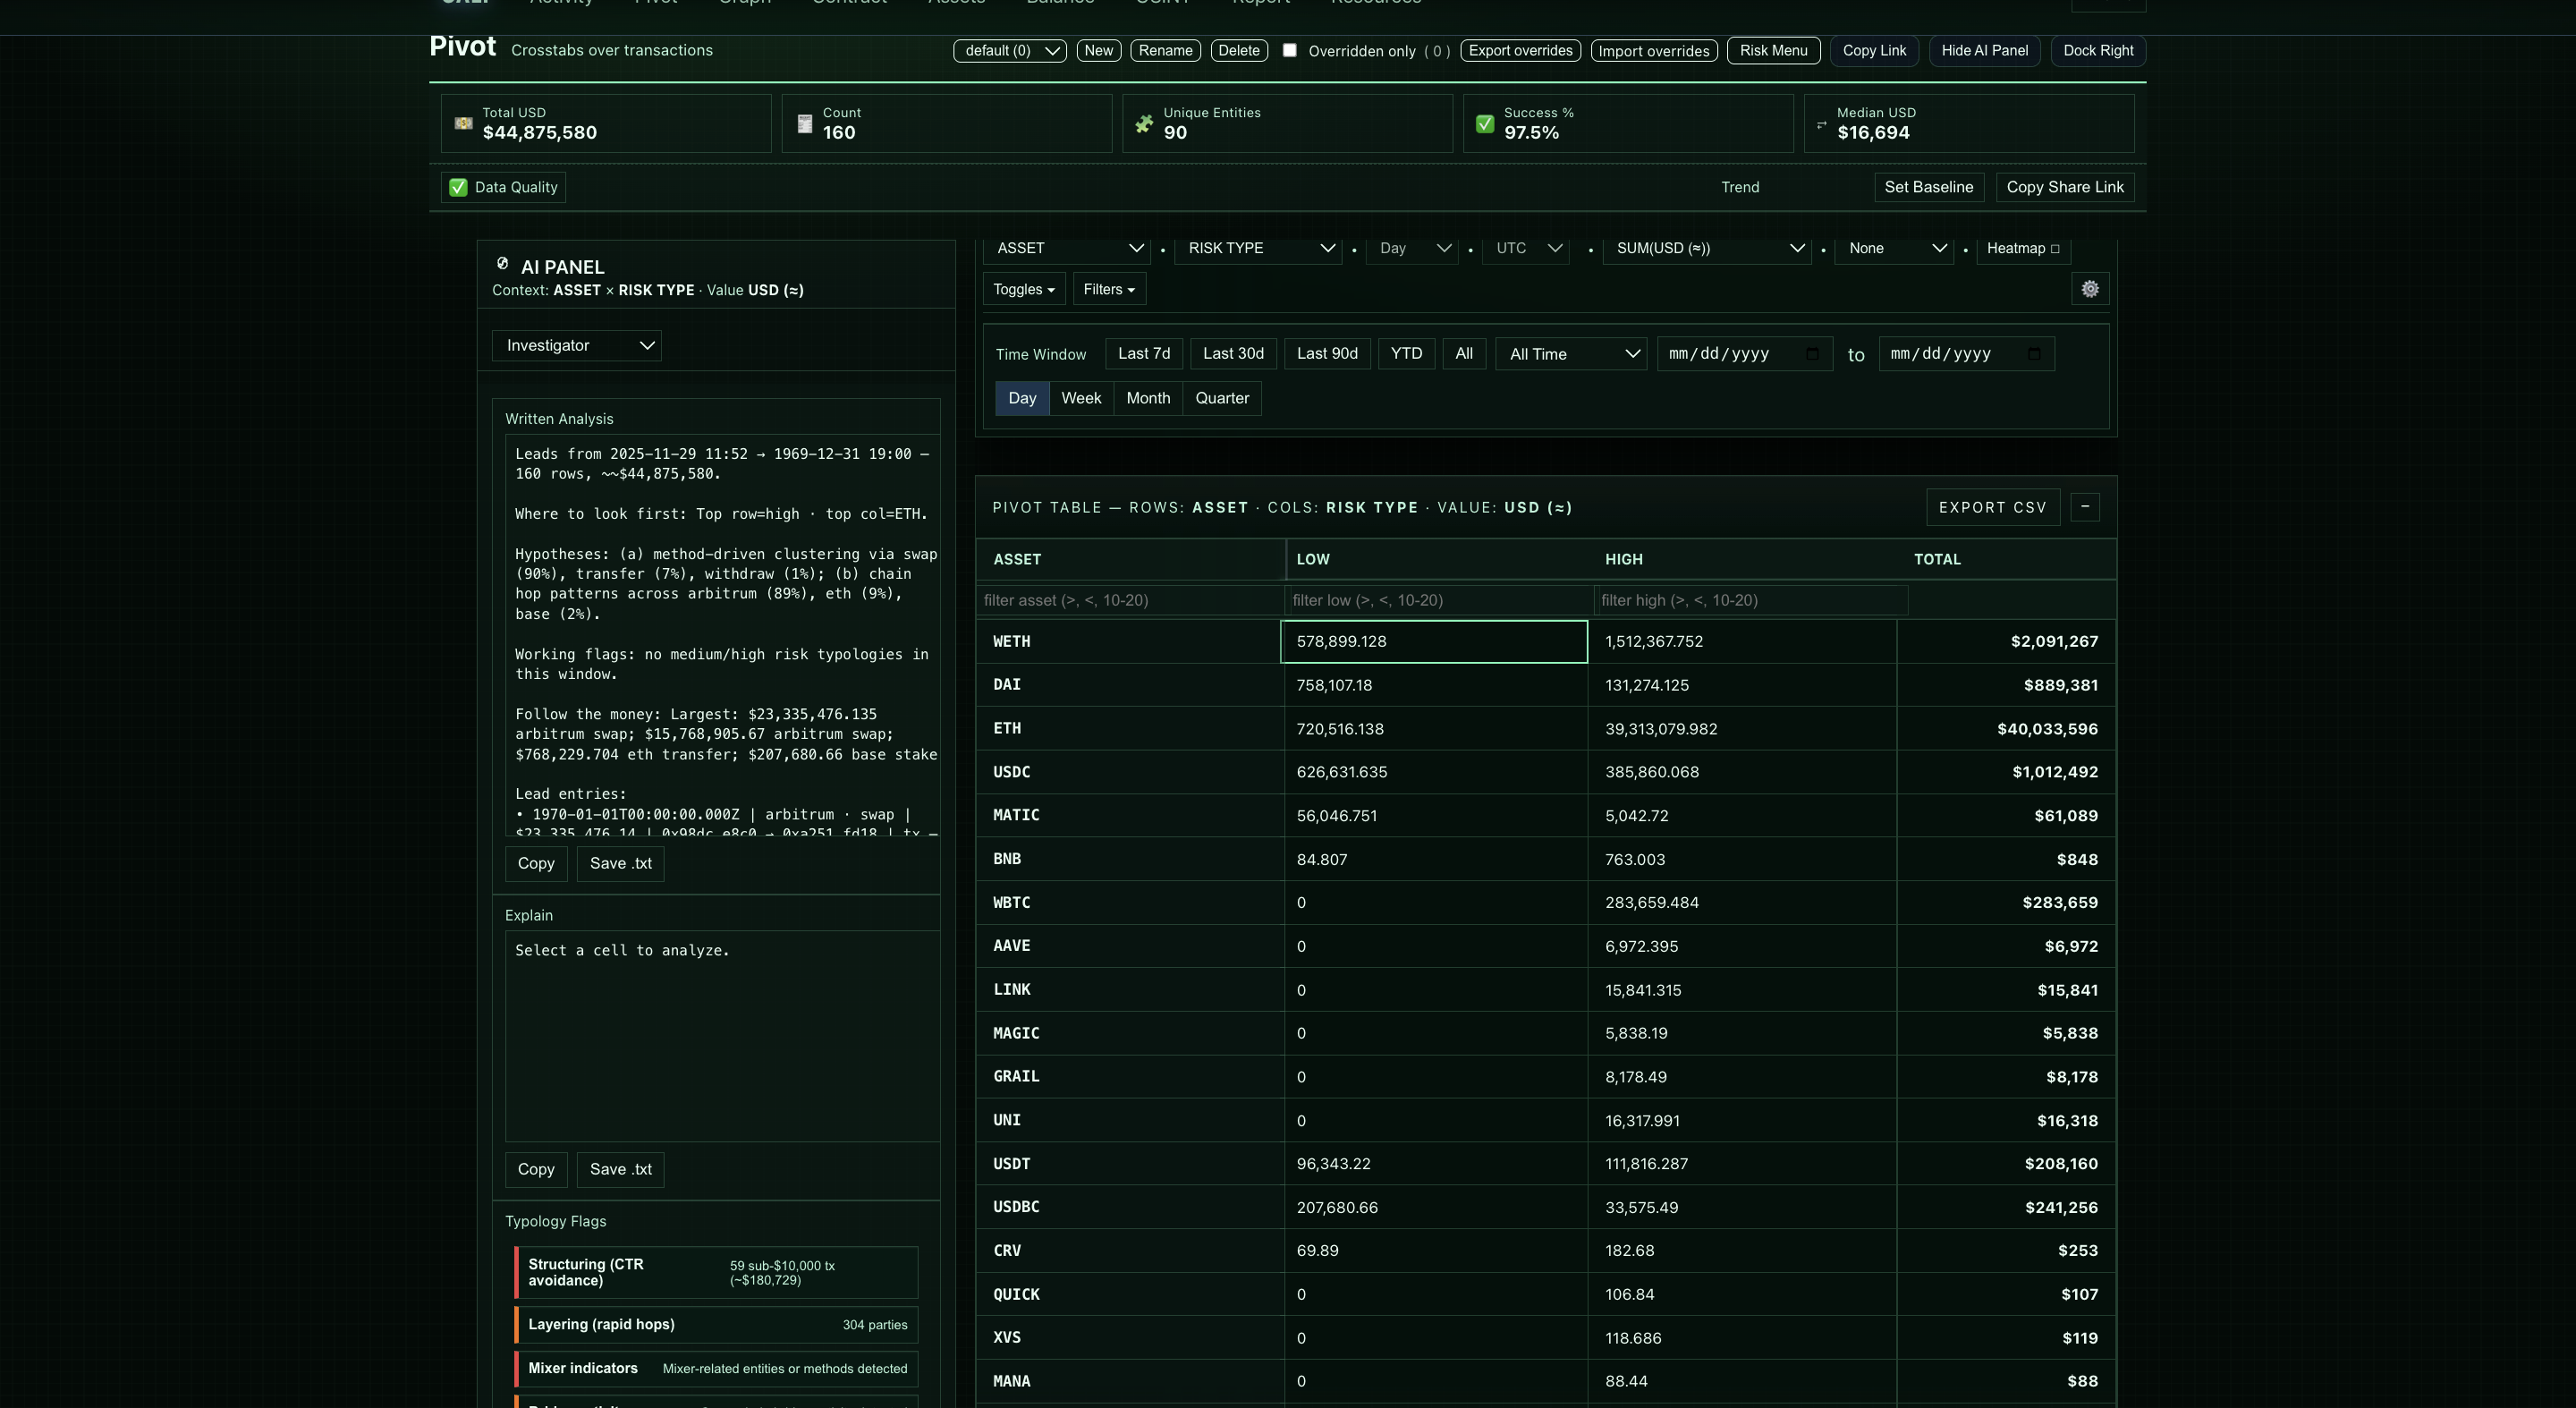
Instead of examining one row at a time, Pivot shows how activity groups into structures, funnels, and segments that should be documented as part of an investigation record.
Investigators struggle to explain patterns, not just individual transactions. This module analyzes activity by chain, asset type, entity, risk band, and flow categories to surface structuring, layering, rapid forwarding, and cash-out signatures.
- Converts raw activity into patterns supervisors understand
- Accelerates escalation decisions
- Supports structured documentation for typologies and escalations
- Structuring-like behavior across amounts, time windows, and counterparties.
- Layering, fragmentation, clustering, and repeated movement patterns.
- Activity grouped by chain, entity, asset, typology, or risk indicator.
- Behavioral summaries that help teams explain why a pattern matters.
- Bucket analysis: chain, asset, risk, typology
- Automatic anomaly detection
- Cross-entity aggregation
- Time-window compression for structuring detection
- Narrative draft and findings summary per bucket
An exchange wallet receives mixed assets from various unrelated senders. This module groups activity by asset, flags unusual concentration, identifies cash-out patterns, and provides a ready-to-use narrative for escalation.
- Groups transactions into buckets by wallet, entity, chain, asset, risk band, typology hints, or time window.
- Surfaces buckets that look like structuring, layering, cash-out patterns, or unusual combinations.
- Shows distributions for volume, count, and risk across different dimensions simultaneously.
- Links each bucket back to underlying rows in Activity for direct review.
- Exchange and fintech compliance teams
- Crypto compliance & AML investigation teams
- Fraud, investigations, and recovery units
- Law-enforcement and public-sector forensic teams
- Risk owners preparing internal reviews
The Cali Panel summarizes the same metrics the investigator sees—buckets, counts, values, risk mixes, entities, and timelines—and proposes narrative drafts and operational summaries for different audiences.
- Generates candidate narratives for high-risk clusters and buckets worth escalation.
- Provides multiple voices (e.g., executive brief, investigator, legal, SOC, minimal technical summary).
- Points out buckets that look like potential typologies to document.
- Produces draft text that can be refined into SAR language or internal summaries.
The system does not make the final decision; analysts remain in control. Structured drafts and summaries accelerate documentation and reduce cognitive load.
This module helps teams move from "we saw some odd transactions" to "we identified a pattern consistent with X" backed by numbers.
- Organize activity around candidate typologies like investment scams, romance scams, cash-out patterns, and more.
- Show how many transactions, what value, and which wallets fall inside each pattern.
- Use filters and pivots to stress-test whether a pattern is meaningful or noise.
- Carry findings forward into Report Station as part of an investigation record.
This module typically comes after Activity in a workflow, once investigators want to know which segments or behaviors matter most in a case or time window.
- Start with raw events and risk bands in Activity, then use Pivot to see where they cluster.
- Move from here into Graph for provenance, OSINT for external posture, and Report Station for write-up.
- Use this module to support program-level views (e.g., what typologies are we seeing this month?) as well as single-case investigations.
Understand patterns, not just individual rows.
Pivot is most useful when it's pointed at real alerts and cases from your environment. We'll walk through how it behaves on your flows, patterns, and typologies—not just canned demos.